

The Dashboard gives you a real-time overview of the entire fleet: tracker connectivity, driver assignment, motion status, engine usage, offline units, alerts, geofence activity and tracker types. It gives managers the information they need to make quick, data-driven decisions from a single screen.
The Dashboard module has five tabs along the top of the screen: Dashboard, Maintenance Dashboard, Geofences Dashboard, Productivity Dashboard and Fuel Dashboard. Click a tab to switch between them. Sections 2.1 to 2.5 describe each tab in turn.
2.1 Main Dashboard
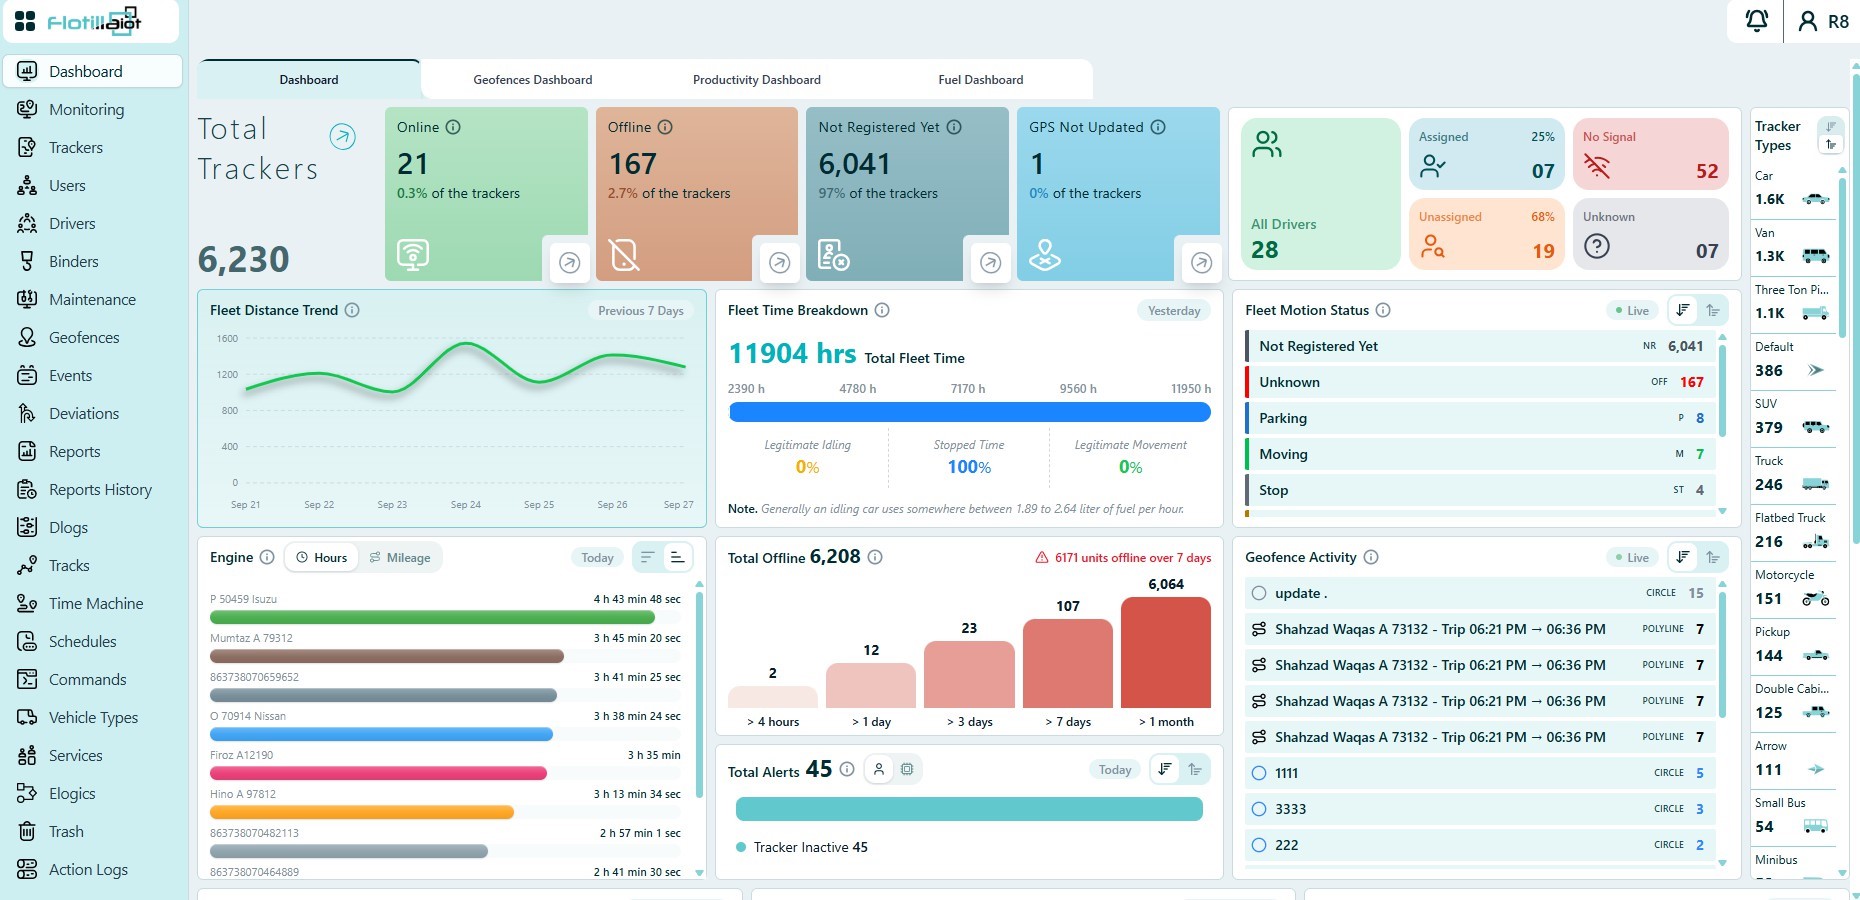
The Main Dashboard shows the key operational indicators for the whole fleet. Every widget has an information icon that explains how its value is calculated.
Tracker Status Cards
The top row of cards shows the total number of trackers and how many are in each communication state, with the percentage of the fleet in each:
- Online — the device is connected and sending data normally.
- Offline — the device is not communicating with the platform.
- Not Registered Yet — no data has been received since the unit was created.
- GPS Not Updated — the device is sending data, but no valid satellite position is available.
TIP Click the arrow on any status card to open the Monitoring module, filtered to the units in that state.
Drivers
The Drivers widget shows driver assignment and connectivity:
- Assigned — drivers currently assigned to a vehicle.
- Unassigned — drivers not assigned to any vehicle.
- No Signal — the driver identification device is not communicating.
- Unknown — the driver identity is not recognized by the system.
Fleet Distance Trend
Shows the total distance travelled by the fleet over the previous 7 days, to help you spot utilization trends and unusual activity.
Fleet Time Breakdown
Shows the fleet’s total time for the previous day, split into Legitimate Idling, Stopped Time and Legitimate Movement percentages.
NOTE An idling car generally uses between 1.89 and 2.64 liters of fuel per hour, so the idling percentage is a direct indicator of fuel waste.
Live Fleet Motion Status
A live widget showing the current movement and activity state of every unit:
- Moving — the vehicle is in motion.
- Idling — the engine is on but the vehicle is not moving.
- Parking — the vehicle is parked with the ignition off.
- Stop — the vehicle is stopped.
- Towing — the vehicle is being towed.
- Not Registered Yet, GPS Not Updated and Unknown — device data states.
Engine
Lists the top units by engine hours or mileage for the current day. Use it to monitor how intensively vehicles are used and to plan maintenance.
Offline Trackers
Groups offline units by how long they have been offline: over 4 hours, over 1 day, over 3 days, over 7 days and over 1 month. Units that have been offline for more than 7 days are highlighted with a warning.
Total Alerts
Shows the number of alerts generated today. You can switch between User alerts and Device alerts.
Geofence Activity
A live list of all geofences, with the number of devices currently inside each zone.
Tracker Types
Groups trackers by their assigned icon type (for example Car, Bus, Crane or Container), so you can analyze the fleet by vehicle class.
Analytics Widgets
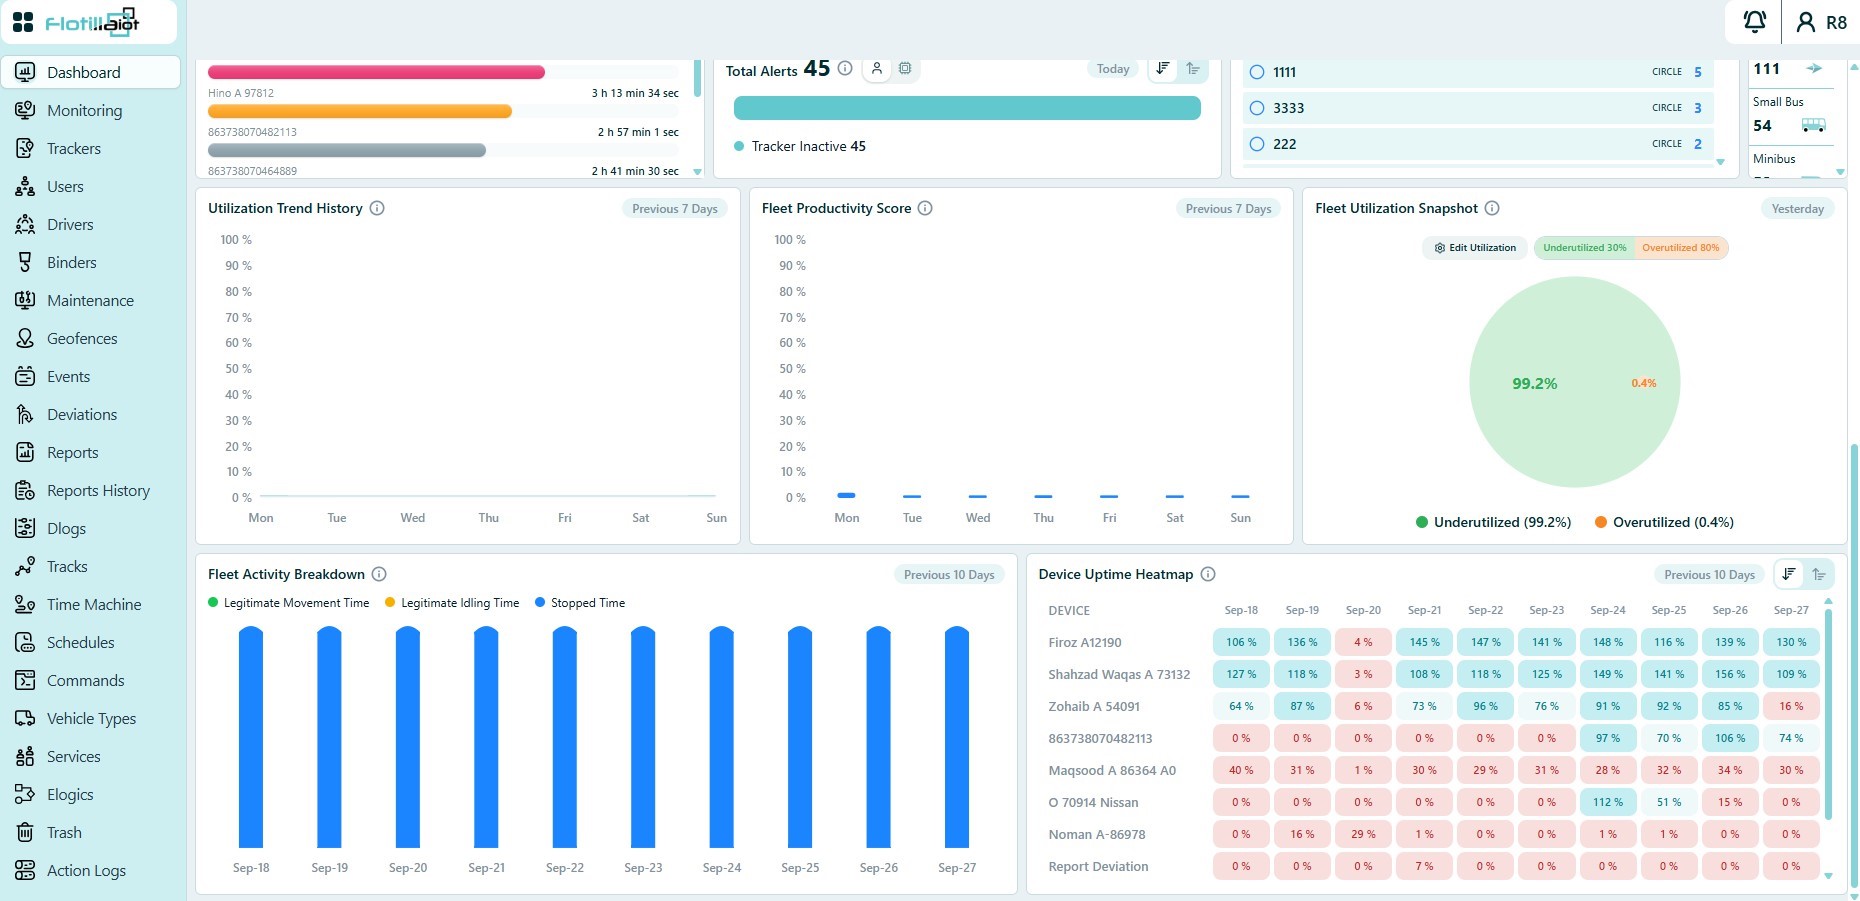
The lower part of the Dashboard provides fleet analytics:
- Utilization Trend History — fleet utilization percentage over the previous 7 days.
- Fleet Productivity Score — daily productivity percentage over the previous 7 days.
- Fleet Utilization Snapshot — yesterday’s share of underutilized and overutilized units. Use Edit Utilization to set the thresholds.
- Fleet Activity Breakdown — legitimate movement, legitimate idling and stopped time per day over the previous 10 days.
- Device Uptime Heatmap — daily uptime percentage per device over the previous 10 days, color-coded to highlight low-activity units.
2.2 Maintenance Dashboard
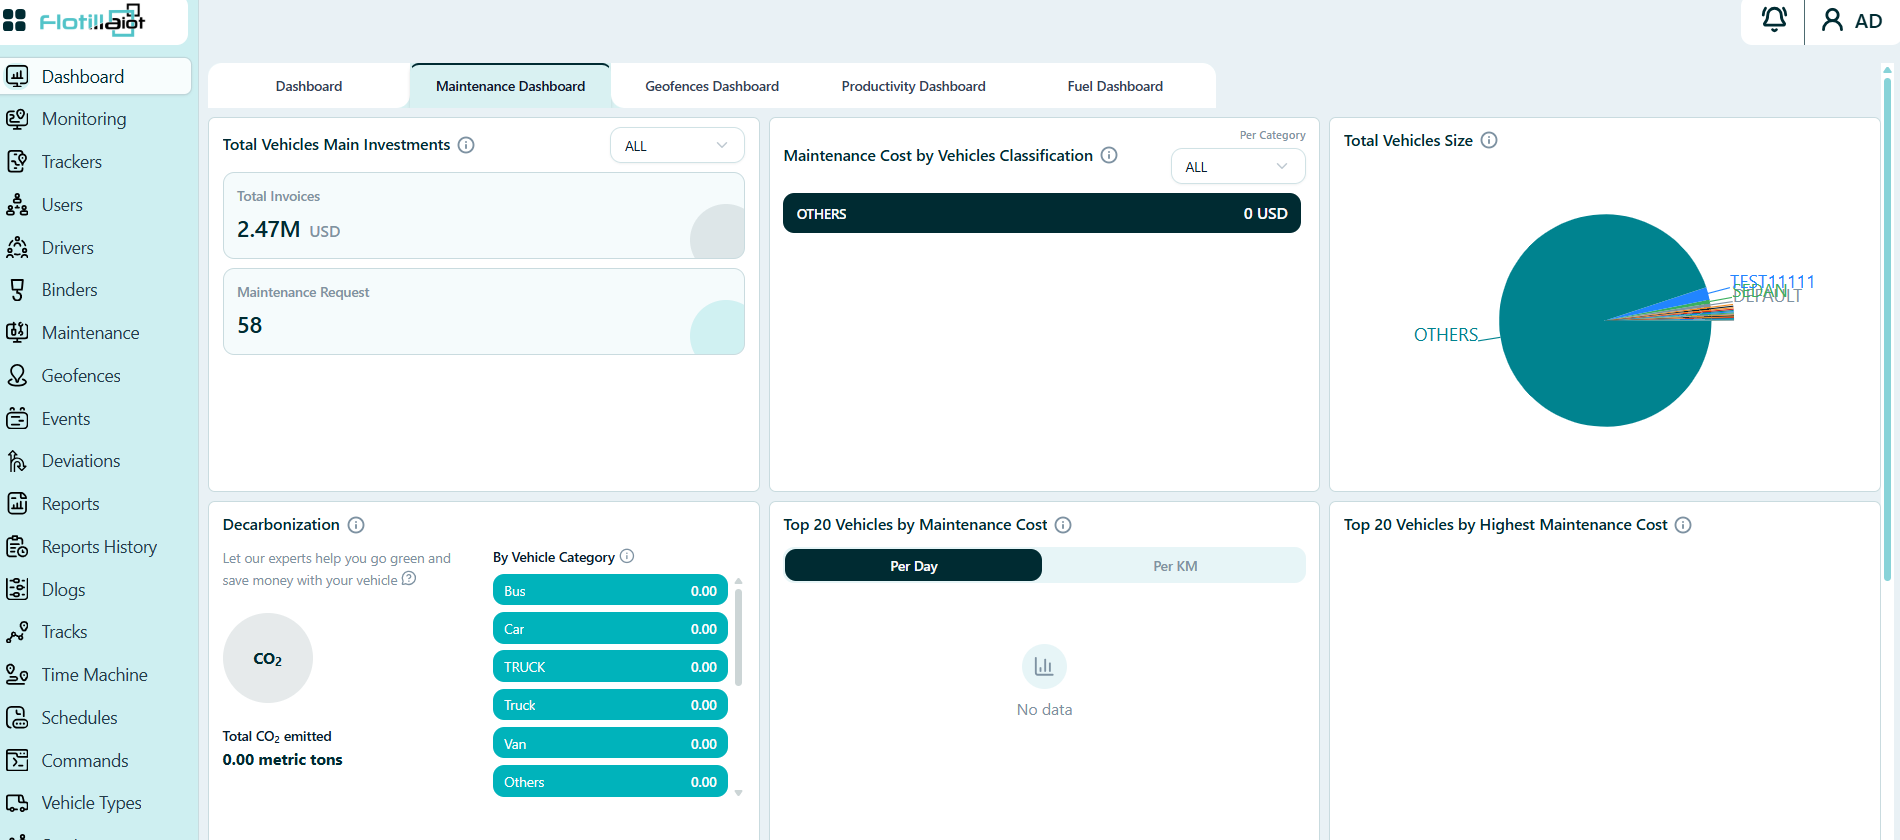
The Maintenance Dashboard tab summarizes maintenance spending and workload across the fleet, together with the fleet composition and estimated CO₂ emissions. Every widget has an information icon that explains how its value is calculated.
Total Vehicles Main Investments
Two cards summarize the maintenance investment of the fleet:
- Total Invoices — the total value of maintenance invoices, in the currency of your account (for example 2.47M USD).
- Maintenance Request — the number of maintenance requests (for example 58).
Use the drop-down at the top right of the widget (ALL by default) to narrow the figures.
Maintenance Cost by Vehicles Classification
Shows the maintenance cost for each vehicle classification, such as Bus, Car, Truck and Van. Use the Per Category drop-down (ALL by default) to choose which categories to show. A category with no recorded cost shows 0.
Total Vehicles Size
A pie chart that shows how the fleet is split by vehicle classification. Each slice is labeled with its category name, so you can see at a glance which classes make up most of the fleet.
Decarbonization
Estimates the CO₂ emitted by the fleet:
- Total CO₂ emitted — the fleet total, in metric tons.
- By Vehicle Category — the emissions for each category, for example Bus, Car, Truck, Van and Others. Scroll the list to see every category.
Top 20 Vehicles by Maintenance Cost
Ranks the vehicles with the highest maintenance cost. Use the Per Day and Per KM tabs to compare the cost per day or per kilometer. When no cost has been recorded, the widget shows No data.
Top 20 Vehicles by Highest Maintenance Cost
Lists the 20 vehicles with the highest maintenance cost.
The lower part of the tab, which you reach by scrolling down, continues with two more widgets.
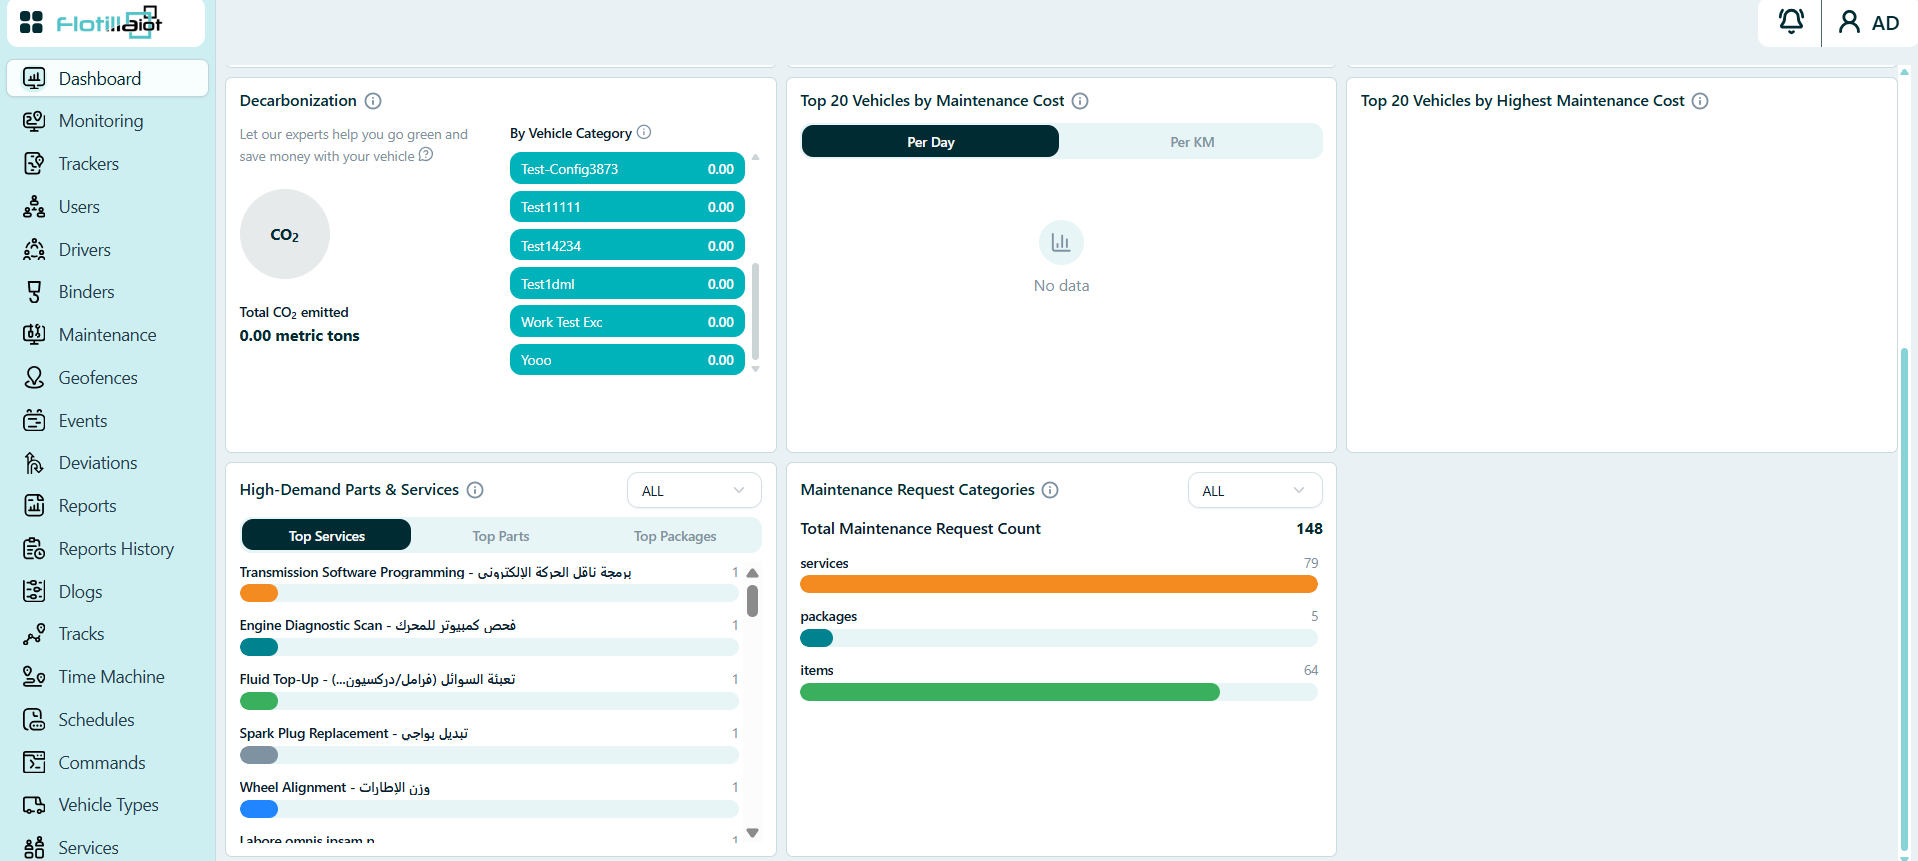
High-Demand Parts & Services
Shows the services, parts and packages that appear most often in maintenance requests. Use the ALL drop-down at the top right of the widget to narrow the list, and the Top Services, Top Parts and Top Packages tabs to choose what is ranked. Each row shows the name (service names can appear in English and Arabic), a bar and its count. Scroll the list to see more rows.
Maintenance Request Categories
Breaks down the maintenance requests by type. Total Maintenance Request Count shows the overall number of requests (148 in Figure 2.4). A bar for each type shows its share: services (79), packages (5) and items (64). Use the ALL drop-down at the top right to narrow the figures.
2.3 Geofences Dashboard
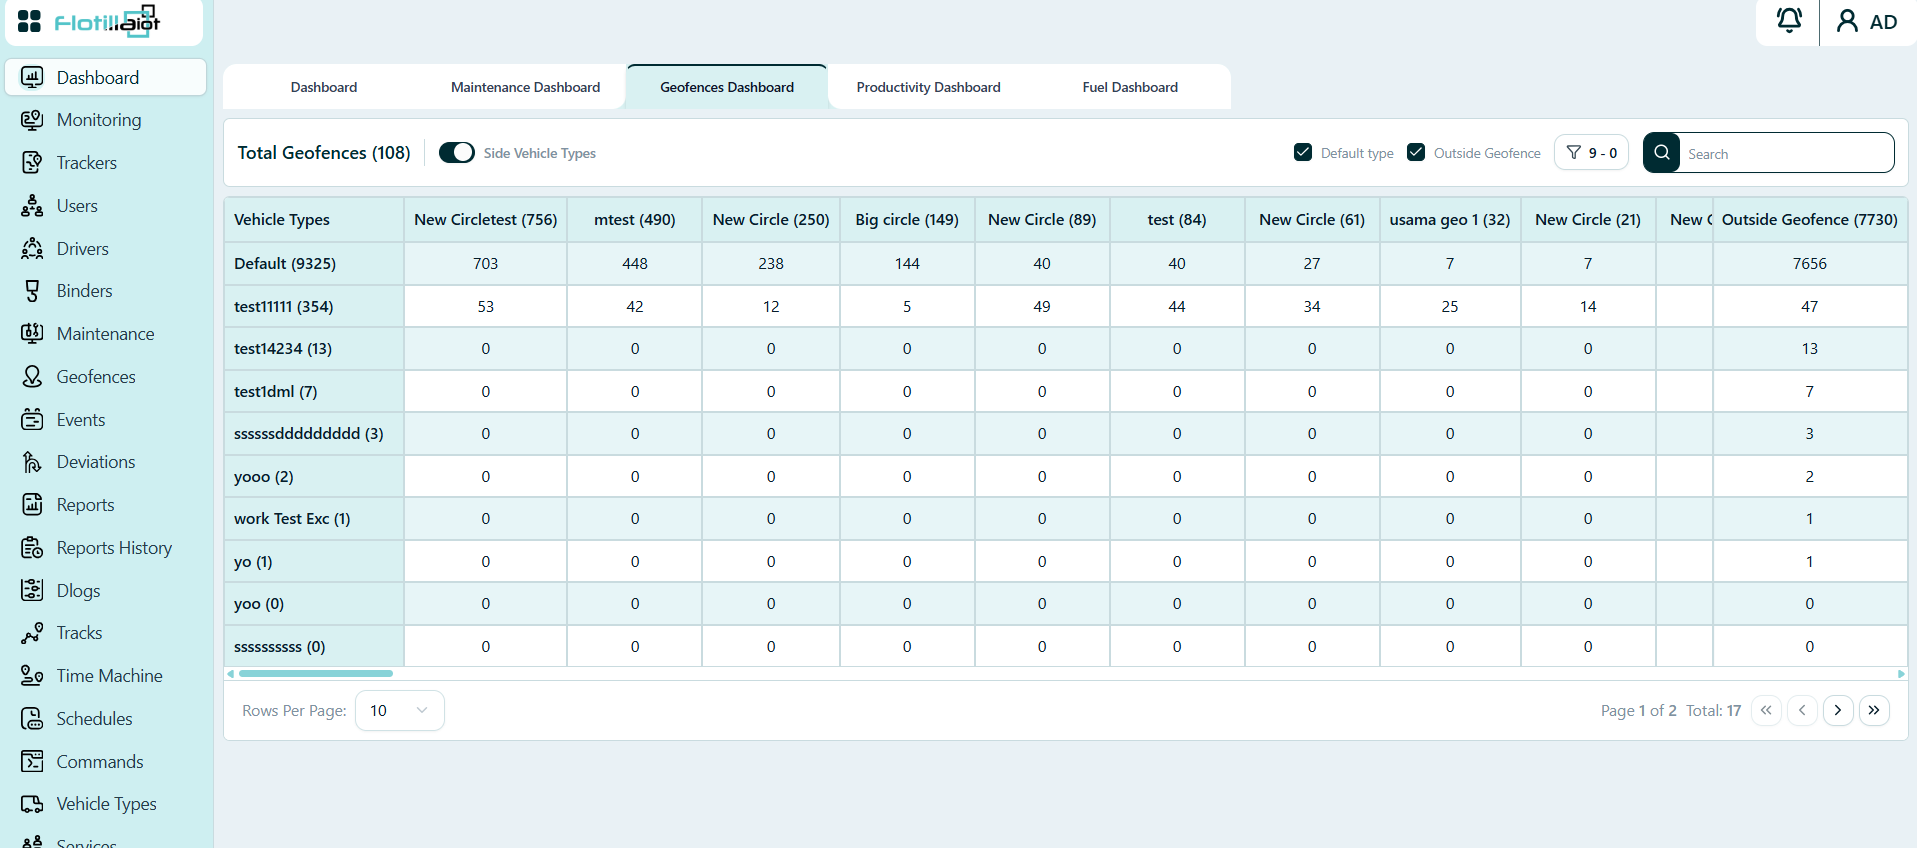
The Geofences Dashboard tab shows, for every geofence, how many units of each vehicle type are inside it right now. Use it to see which zones are busy and which vehicle types occupy them. Create and manage the zones themselves in the Geofences module (Chapter 9).
Reading the Table
The title at the top left shows the Total Geofences on the account (108 in Figure 2.5). Below it, the table is a matrix of vehicle types and geofences:
- Rows — one row per vehicle type, with the number of units of that type in brackets, for example Default (9325).
- Columns — one column per geofence, with the number of units currently inside it in brackets, for example New Circle (250). The last column, Outside Geofence, counts the units that are not inside any geofence.
- Cells — the number of units of that vehicle type inside that geofence. The cells of a column add up to the number in its header.
Controls
- Default type and Outside Geofence checkboxes — choose whether the Default vehicle type and the Outside Geofence column are included.
- Search — find a geofence or vehicle type quickly.
- Rows Per Page and the page buttons at the bottom — move through the table (17 rows over 2 pages in Figure 2.5). Use the horizontal scroll bar to see more geofence columns.
2.4 Productivity Dashboard
The Productivity Dashboard tab compares how intensively each vehicle category is used against a target that you set, so you can quickly find the categories that fall short.
Benchmark and Filters
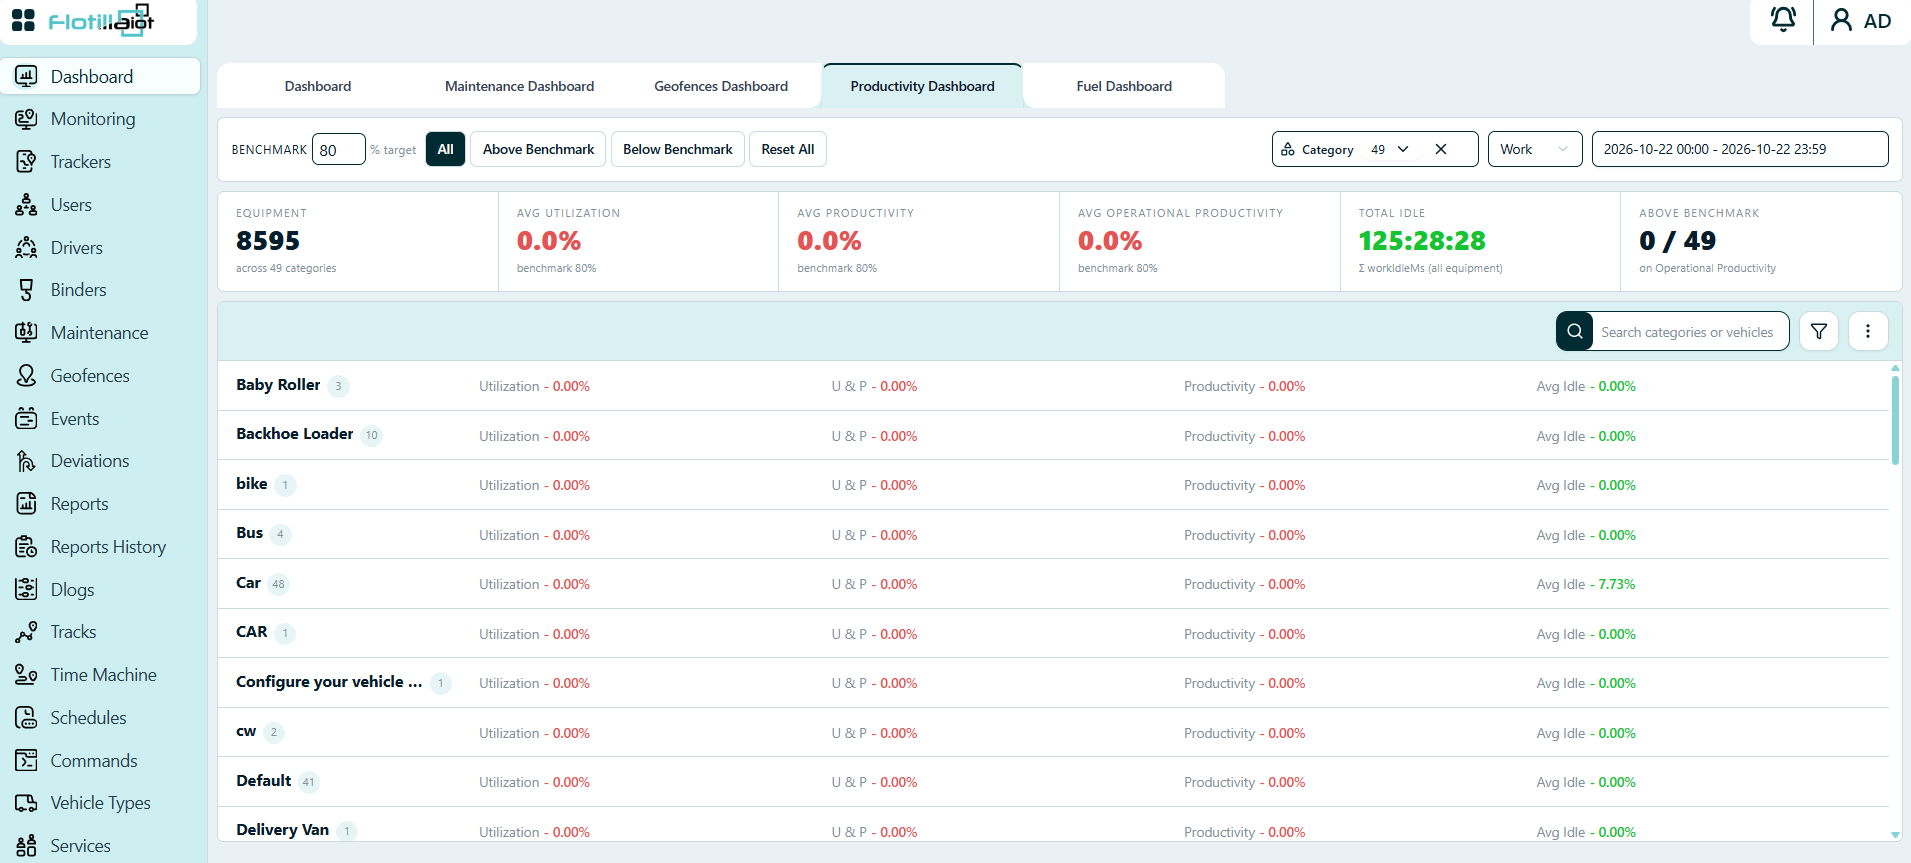
- Benchmark — enter the target percentage (80 in Figure 2.6). Utilization and productivity are compared against it.
- All, Above Benchmark and Below Benchmark — show every category, only the categories above the benchmark, or only those below it. Reset All clears the filters.
- Category — choose the vehicle categories to include (49 in Figure 2.6). Use the cross to clear the selection.
- Date range — the start and end date and time of the period that is analyzed. Figure 2.6 shows one full day.
Summary Cards
The row of cards at the top summarizes the selection:
- Equipment — the number of units included and the number of categories (8595 units across 49 categories).
- Avg Utilization — the average utilization of the selected units, shown against the benchmark.
- Avg Productivity — the average productivity, shown against the benchmark.
- Avg Operational Productivity — the average operational productivity, shown against the benchmark.
- Total Idle — the total idle time of all selected equipment, in hours, minutes and seconds.
- Above Benchmark — how many categories are above the benchmark on operational productivity, out of all categories (0 / 49 in Figure 2.6).
Category List
Below the cards, each vehicle category is listed with the number of units in it and four percentages: Utilization, U & P, Productivity and Avg Idle. The values are color-coded against the benchmark. Use the Search categories or vehicles box, the filter button and the menu at the top right of the list to find rows, and scroll the list to see every category.
The Main Dashboard also shows fleet-level productivity indicators: the Fleet Productivity Score, the Utilization Trend History and the Fleet Utilization Snapshot (see Section 2.1).
2.5 Fuel Dashboard
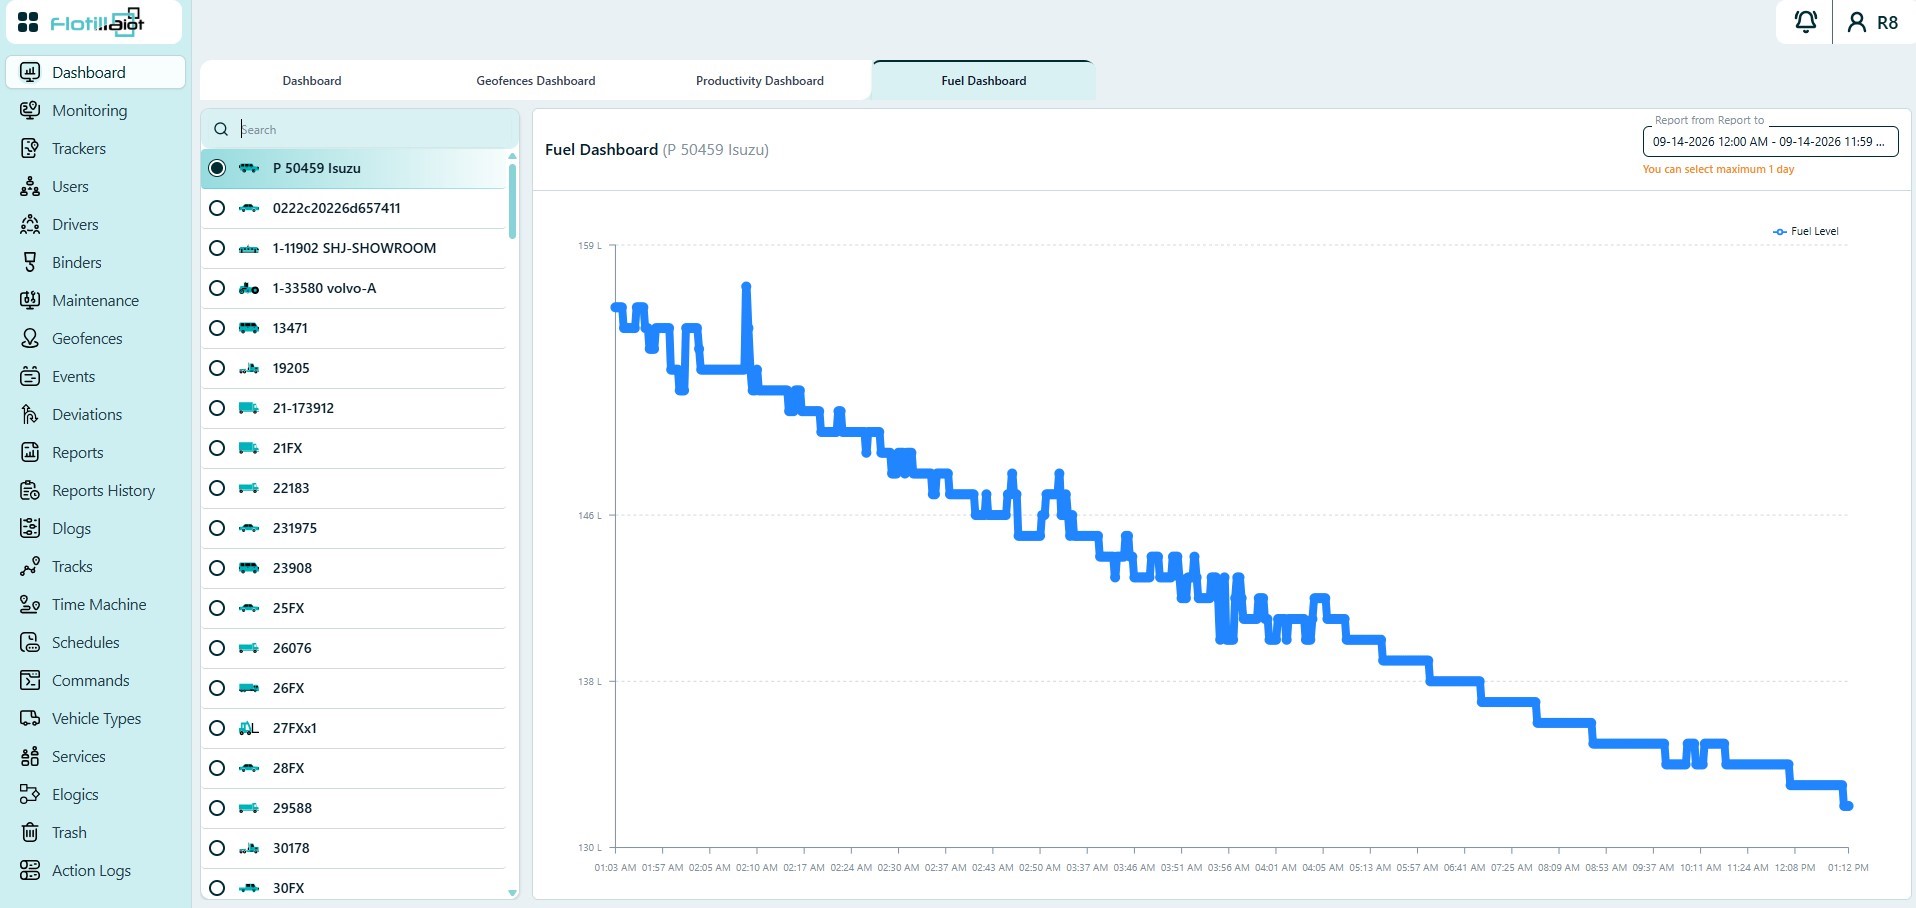
The Fuel Dashboard tab shows the fuel level graph for a selected device.
- Choose a device from the panel on the left.
- Select the date range in the top-right corner.
- Read the Fuel Level curve: sharp rises show refills, and drops show consumption or drains.
NOTE The maximum date range for the fuel graph is 1 day.